

Dive deeper into this,
Please visit the live website here.
What is the Data?
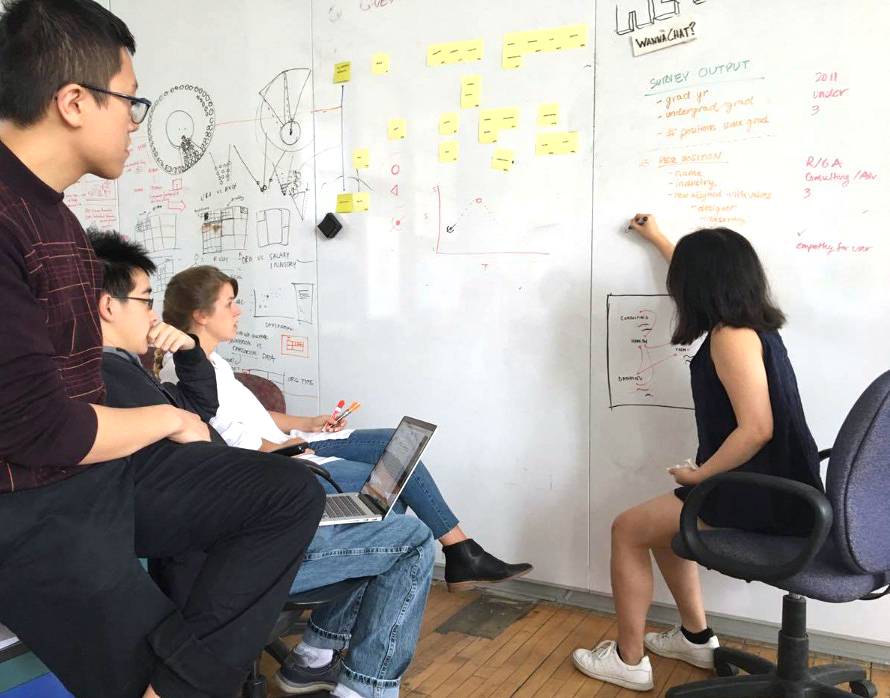
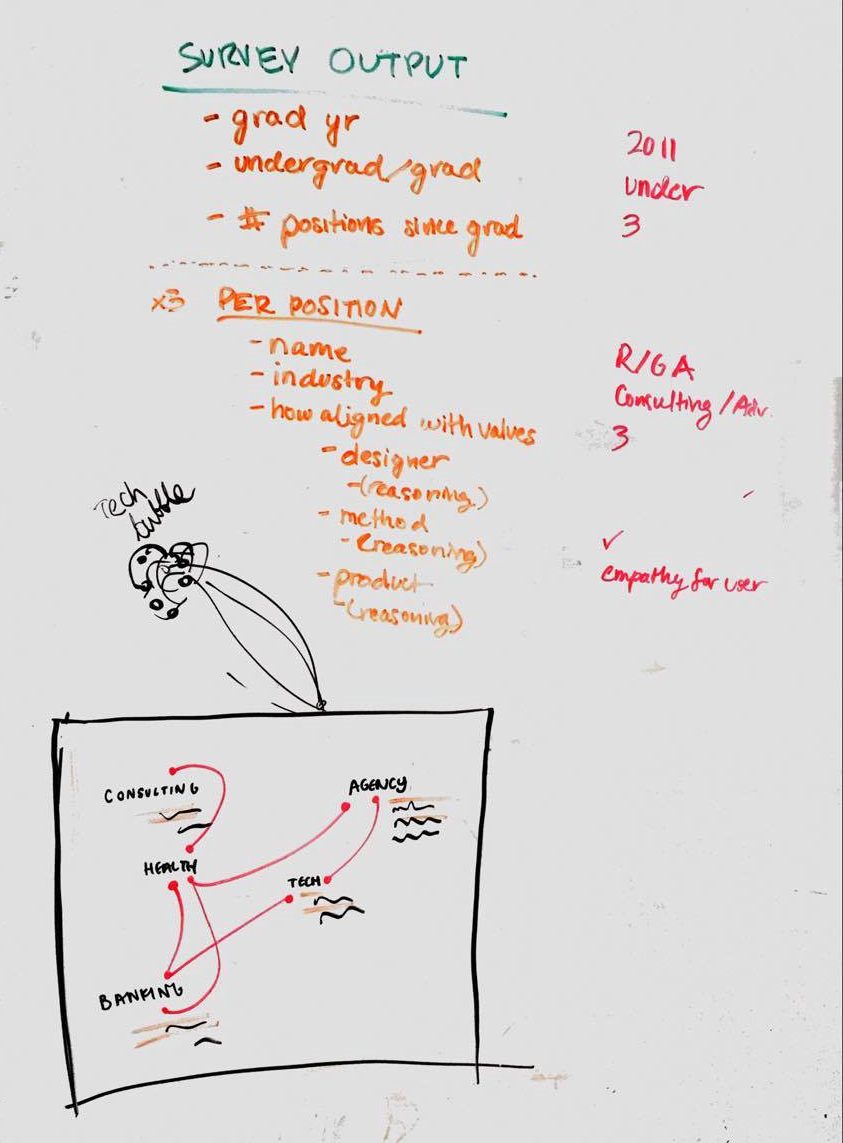
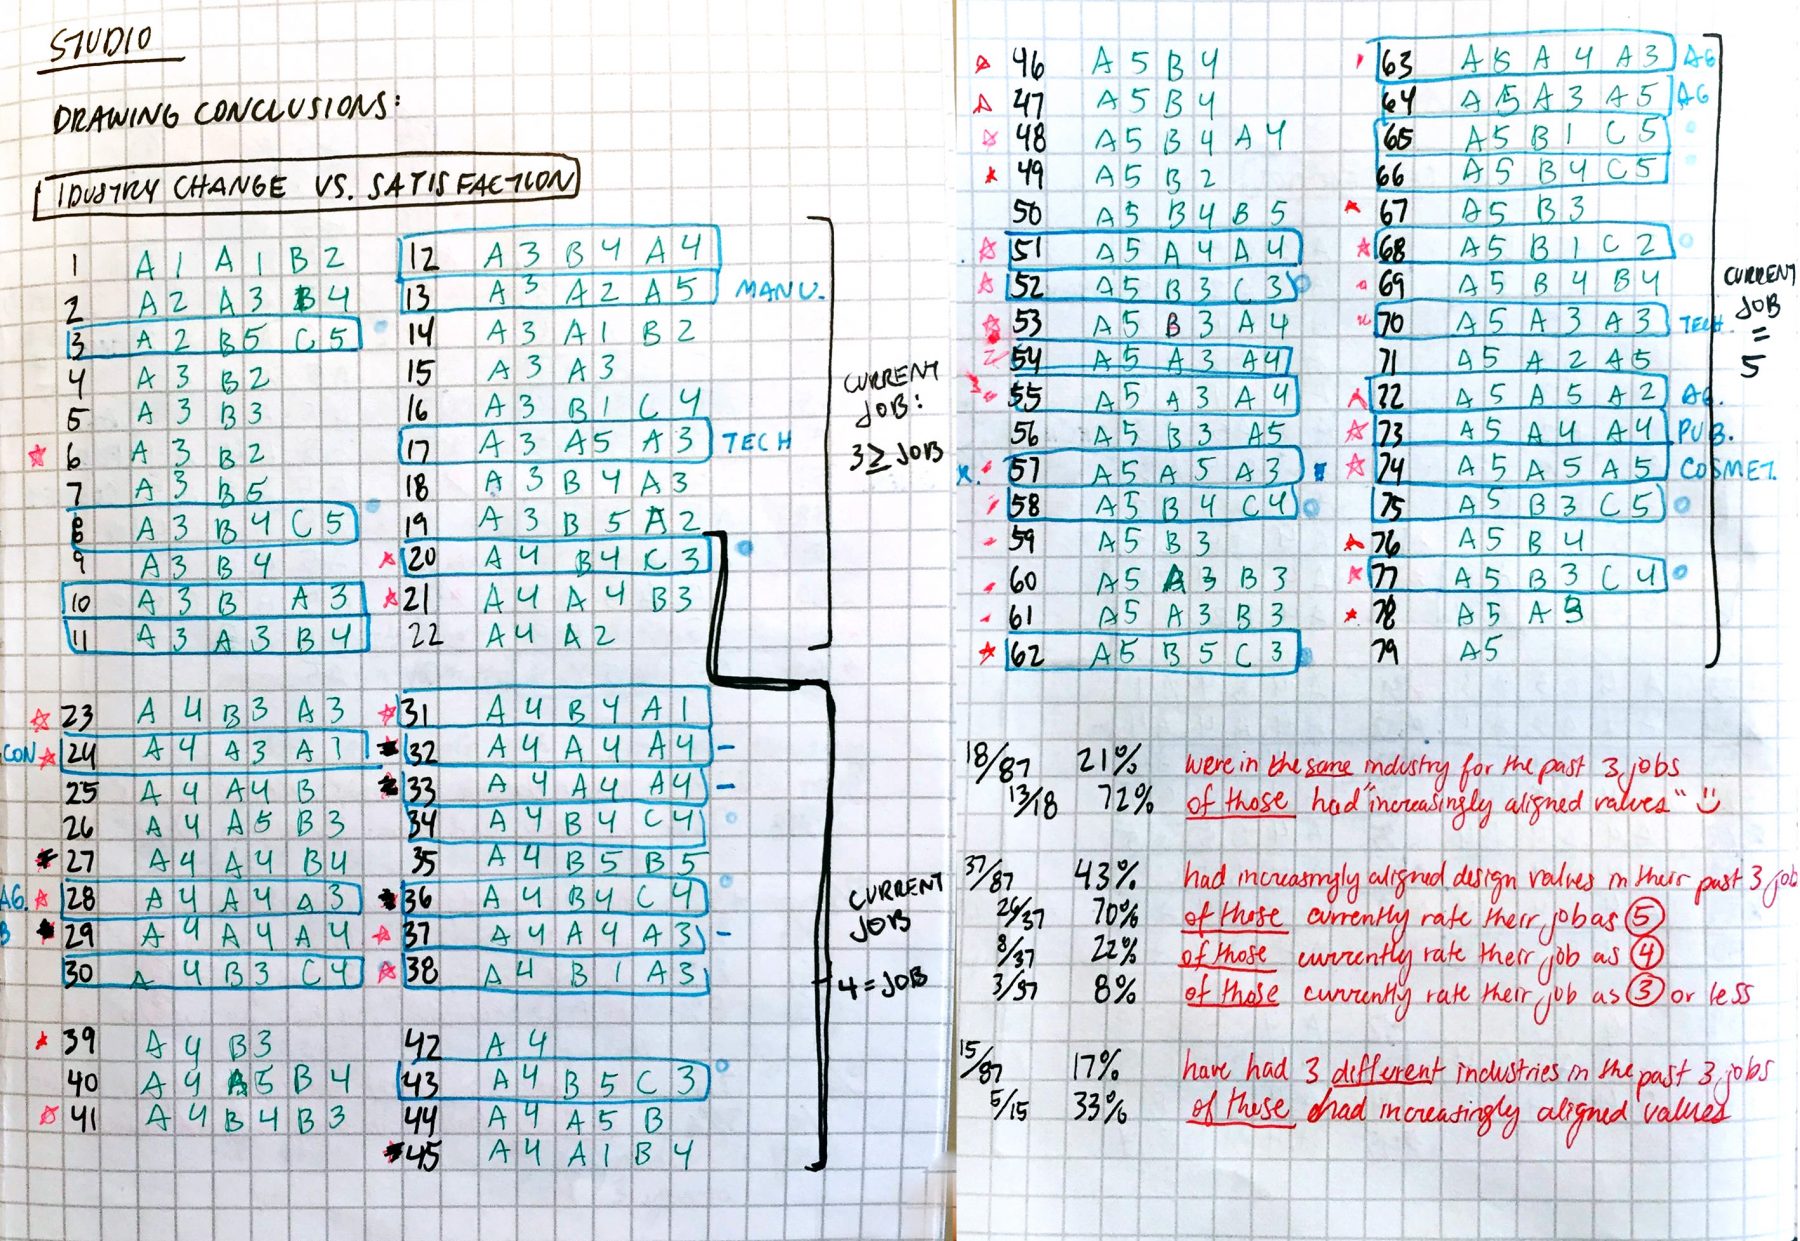
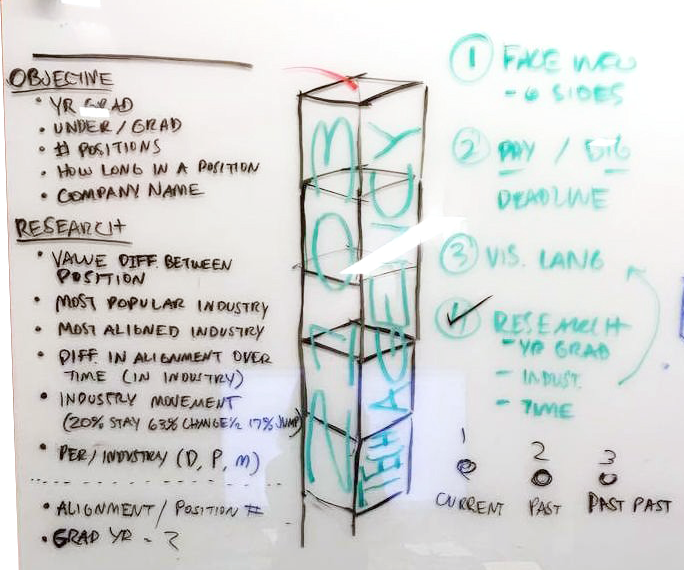
Finding a professional environment that aligns with designers’ values is very important to students at Carnegie Mellon School of Design. They recognize that across each industry and company, the value of design varies widely. How can students find a job that shares their values? To begin to answer this questions our team sent out a survey to the CMU School of Design alumni in New York. We wanted to know what positions they have held in their past three experience, and how aligned they felt the company was to their design values. The alumni further elaborated on how aligned, or misaligned, their values were in three areas: their role as a designer, the methods of the design process, and the final designed product. These areas were determined by the previous part of the assignment, The AIGA Future of Design.
Visualizing the Data
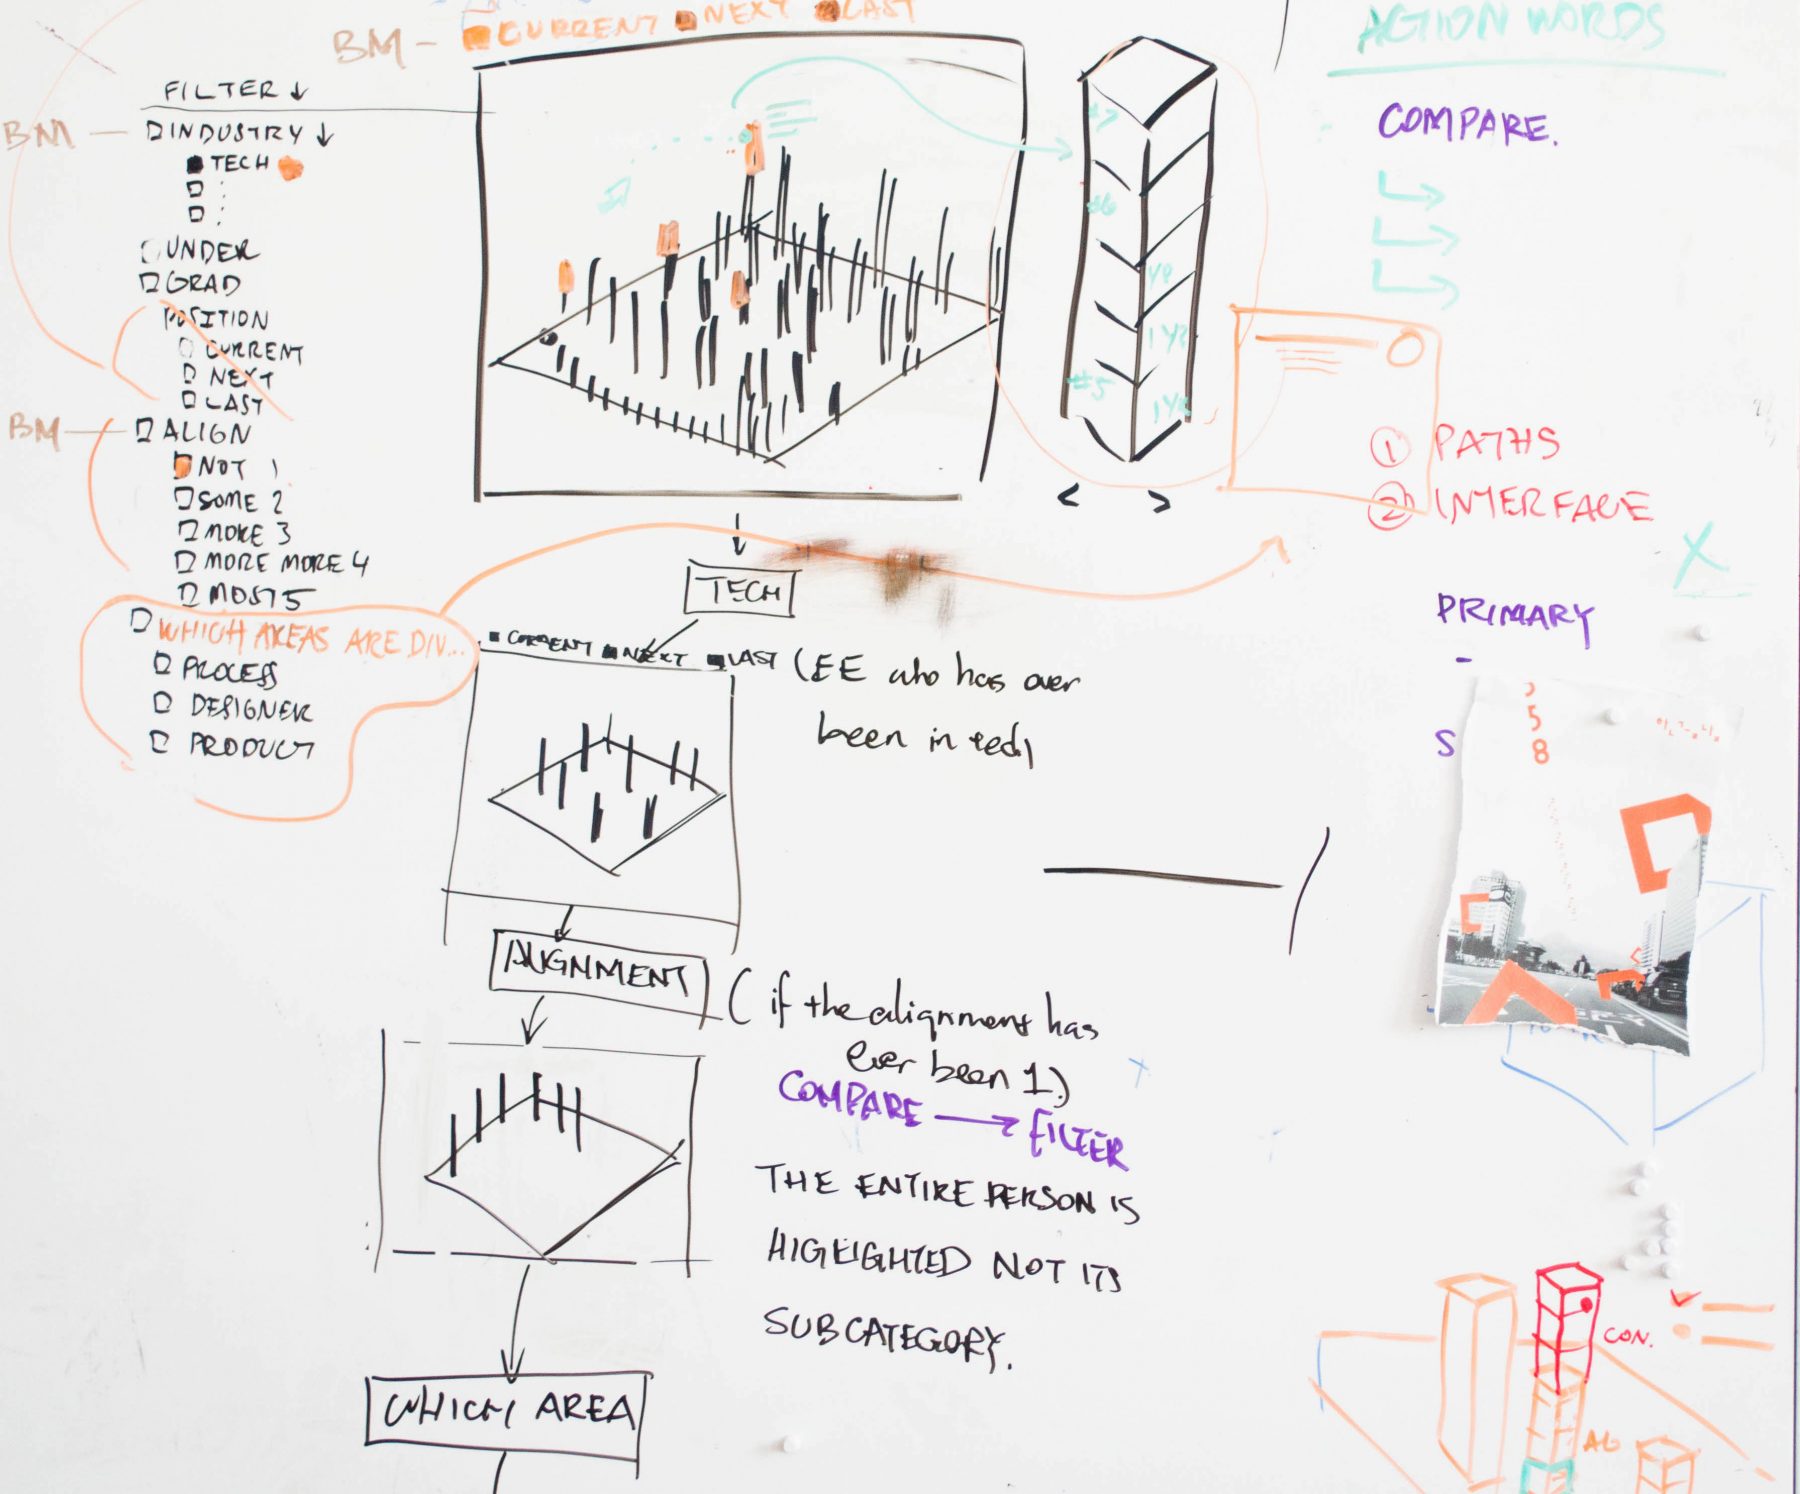
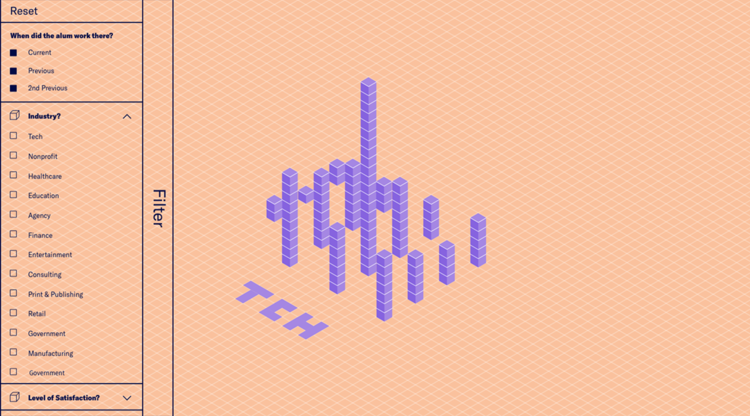
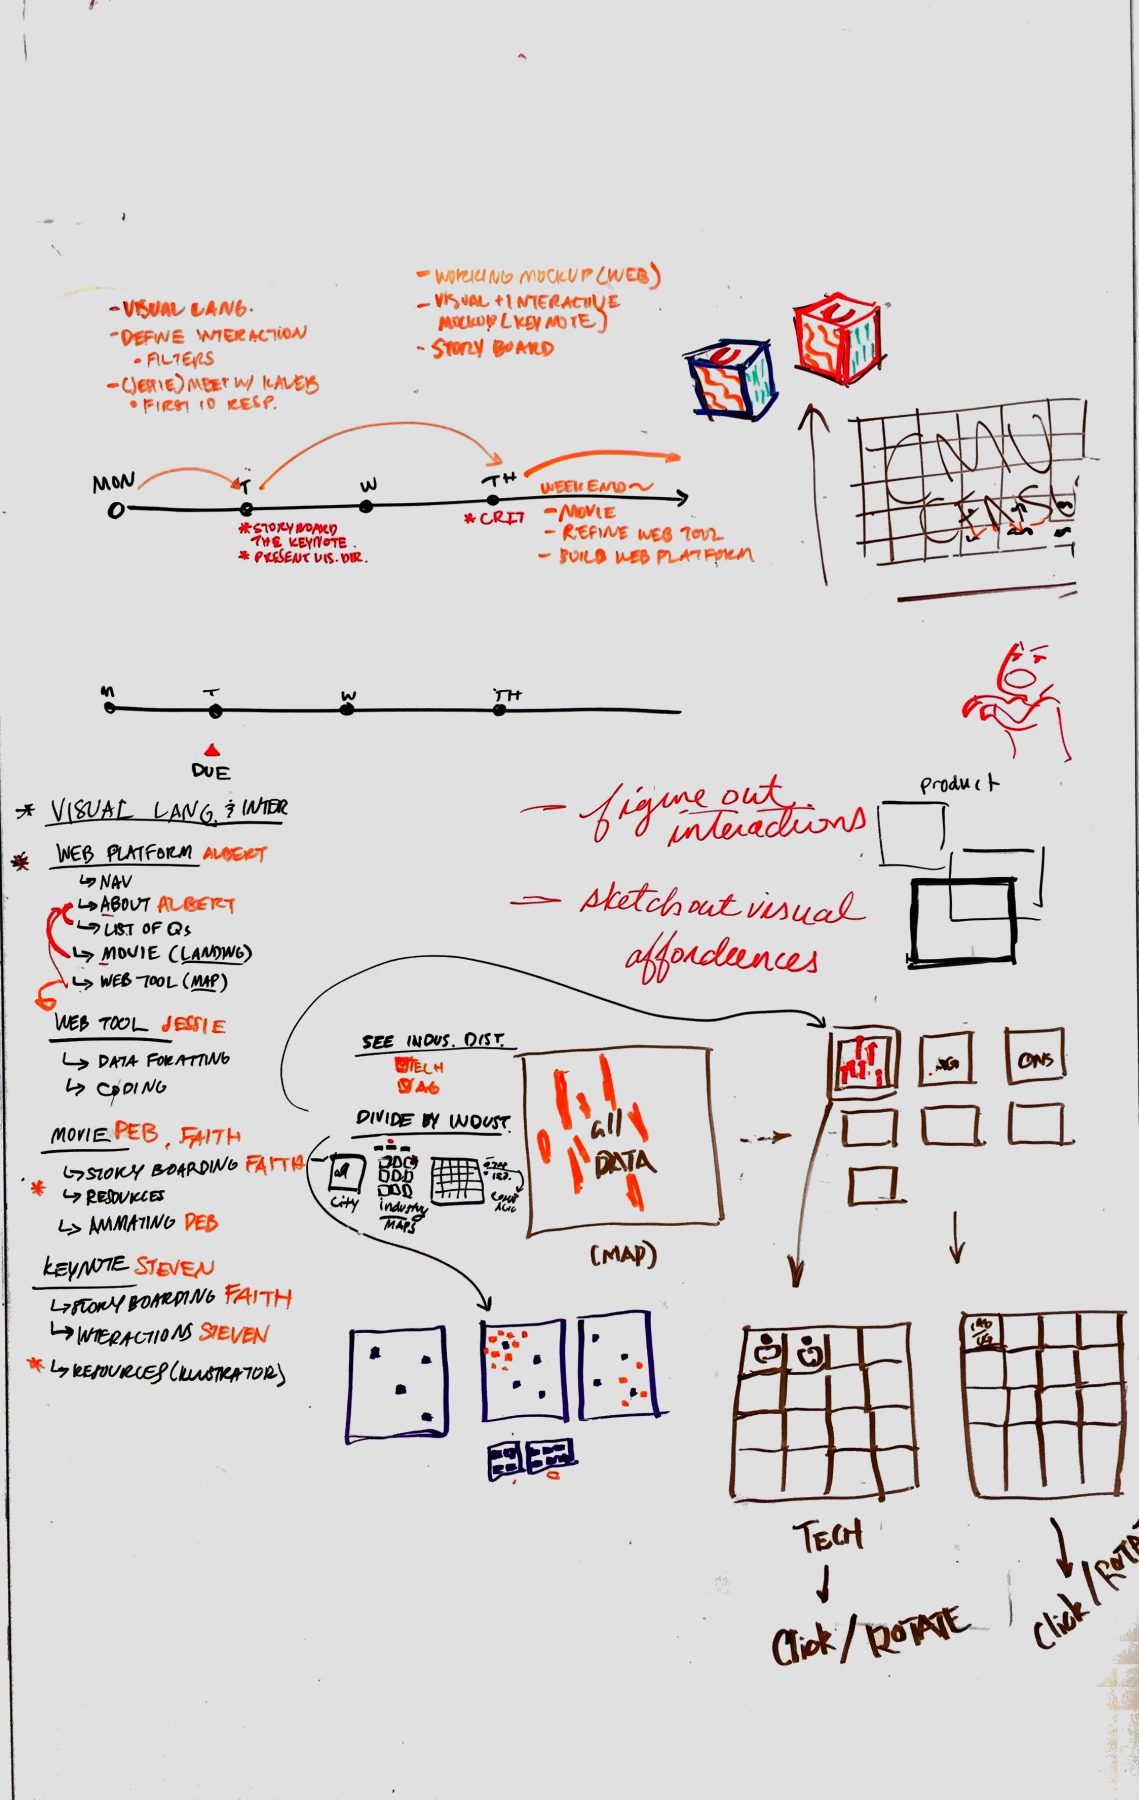
Using data collected from alumni of the CMU School of Design, we wanted the audience to be able to explore the individual responses, but also see patterns across responses. Therefore the visualization needed to be intractable so that each user could explore and discover based on their particular interests. For example, if a current student wanted to see all New York alumni in health care industry, they should be able to filter responses through this but also view the individual entry. We felt that an web platform would best suit this interaction with the data. From there we brainstormed various methods of visualizing the data.
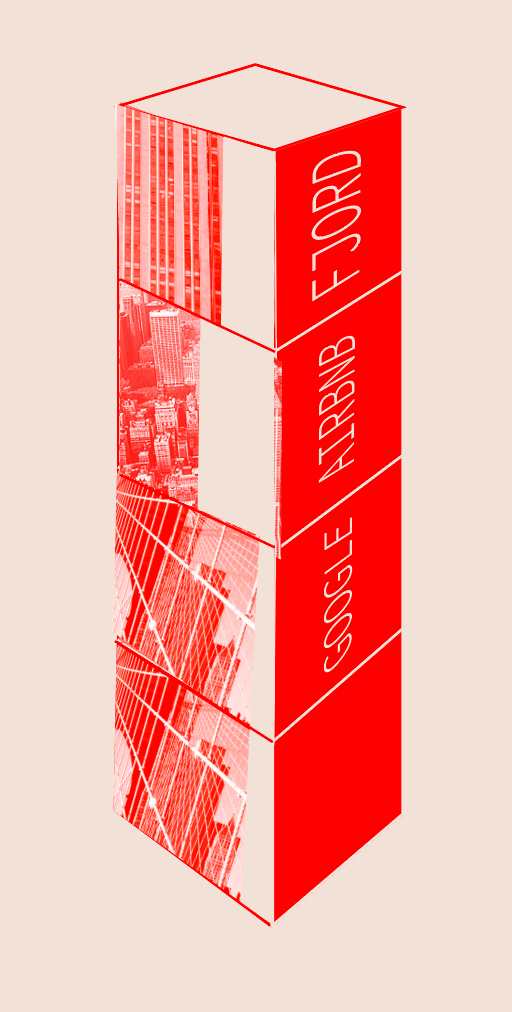
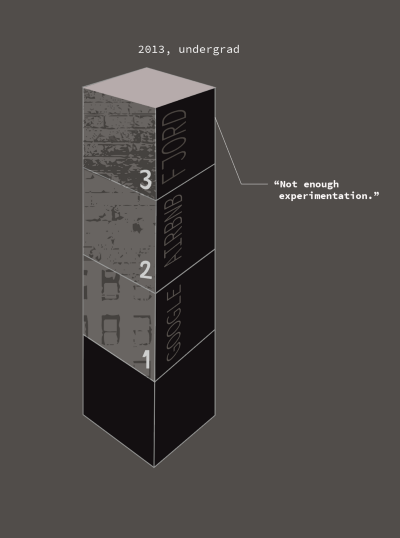
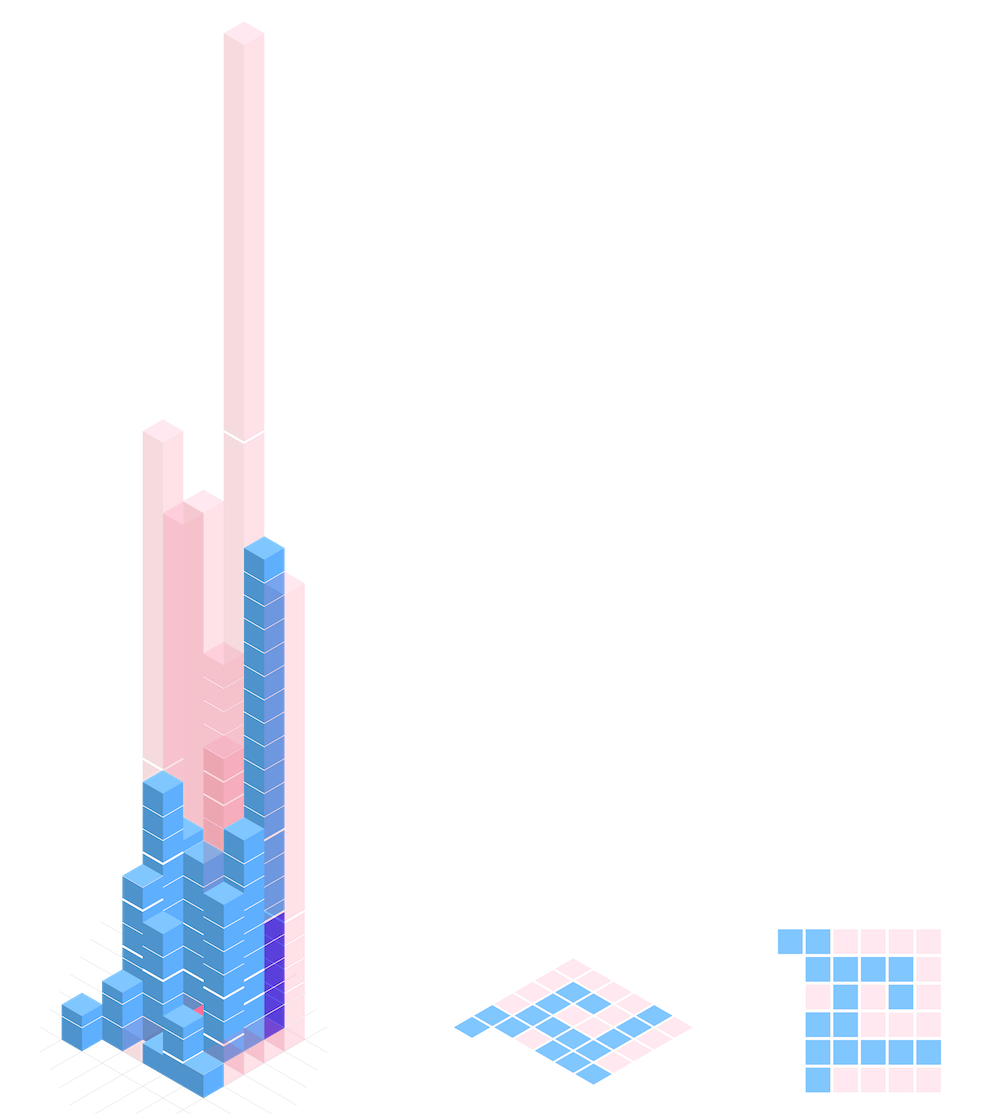
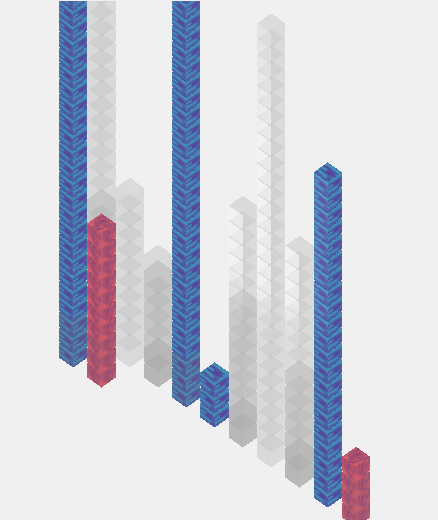
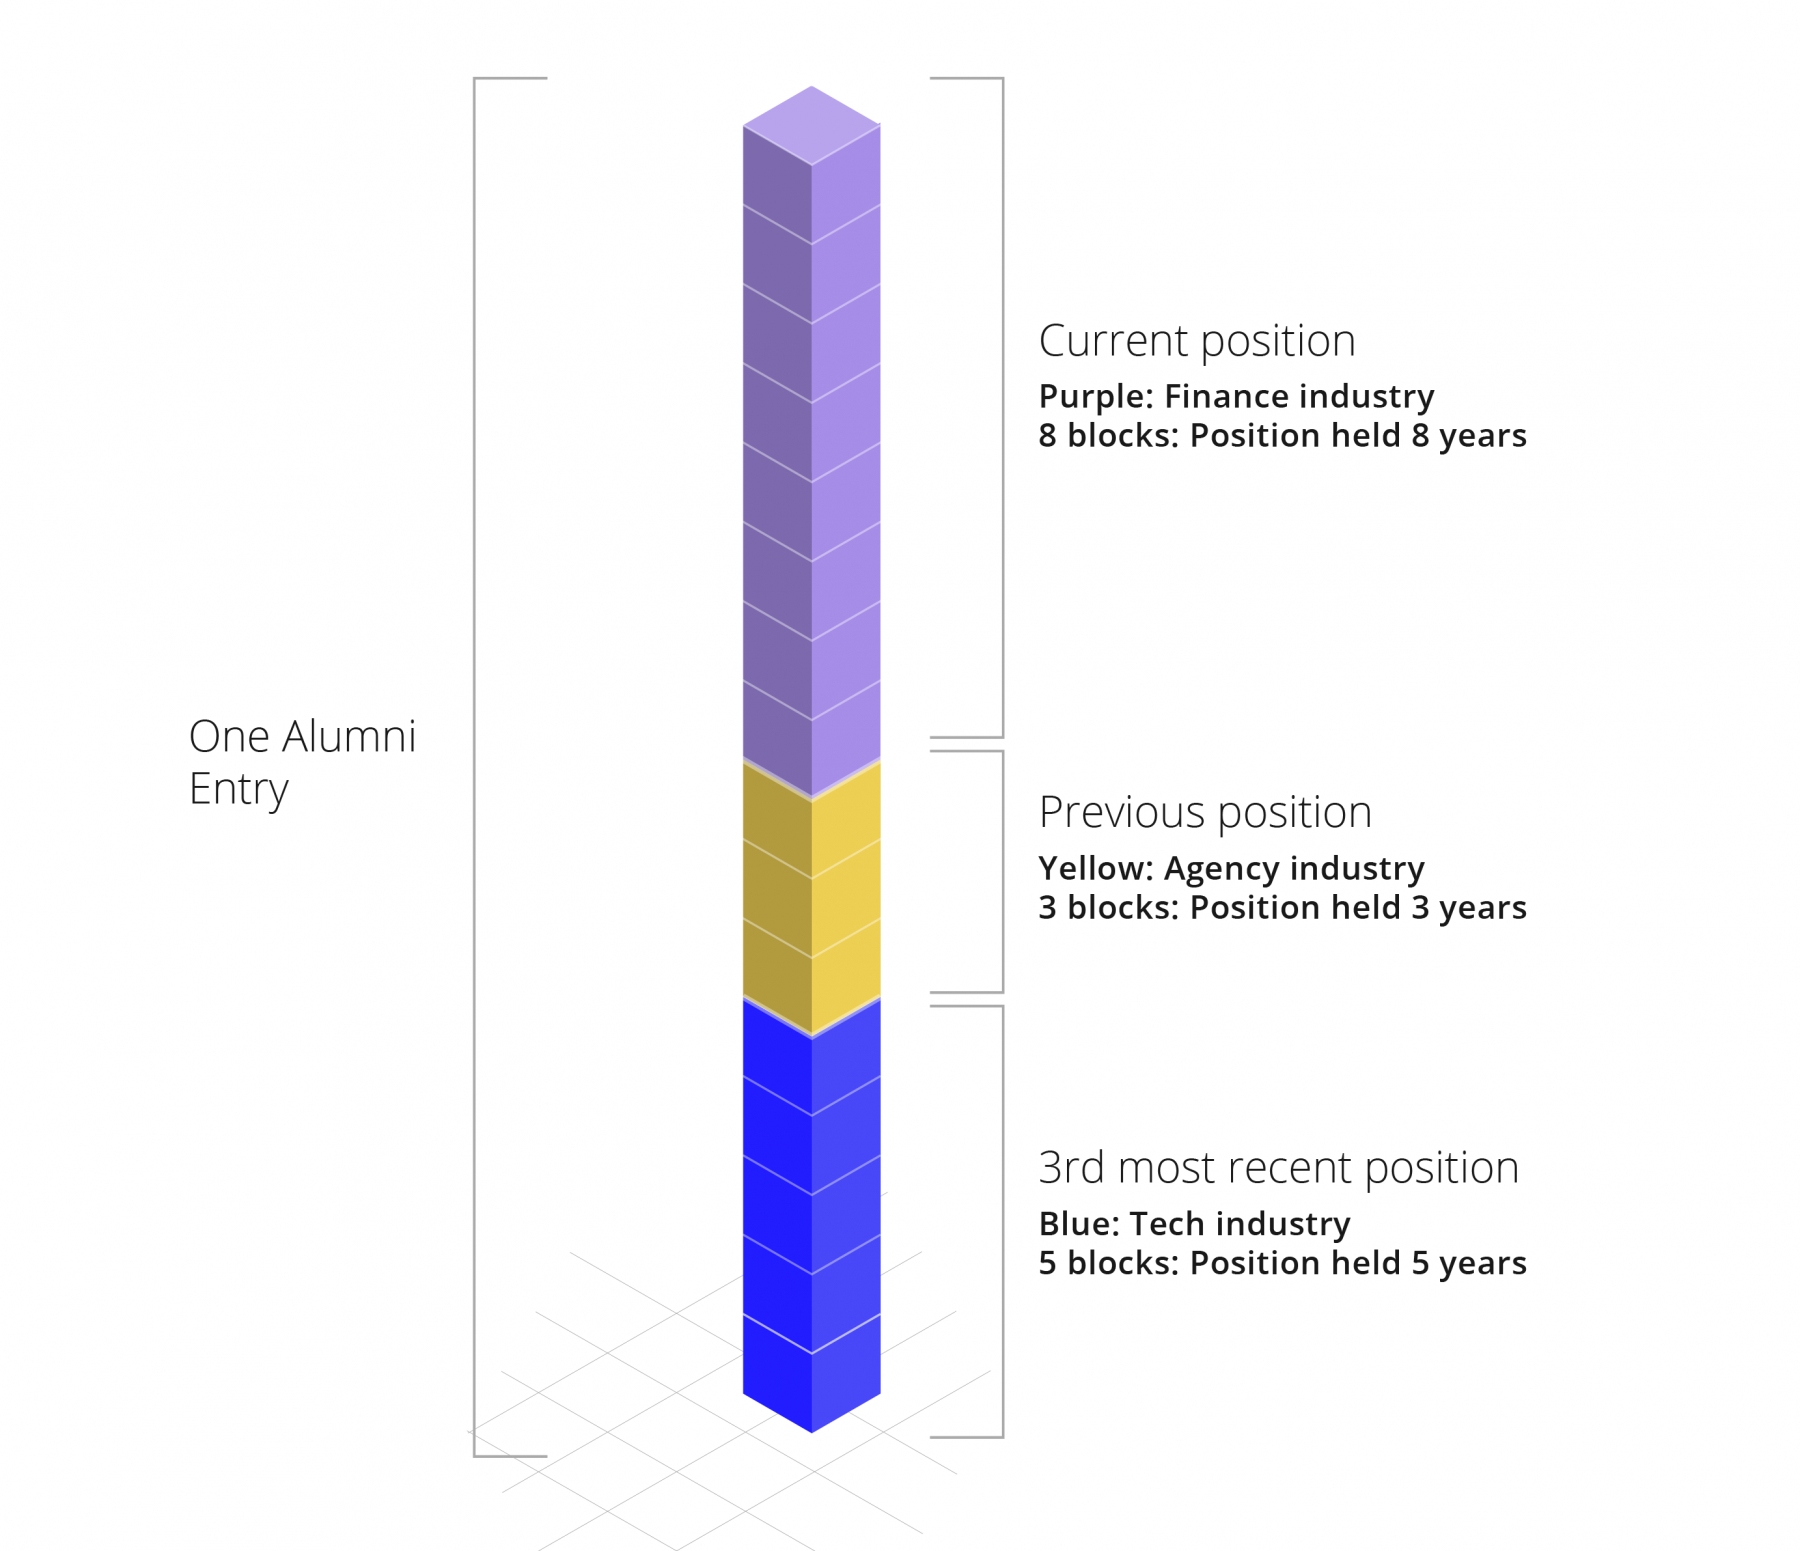
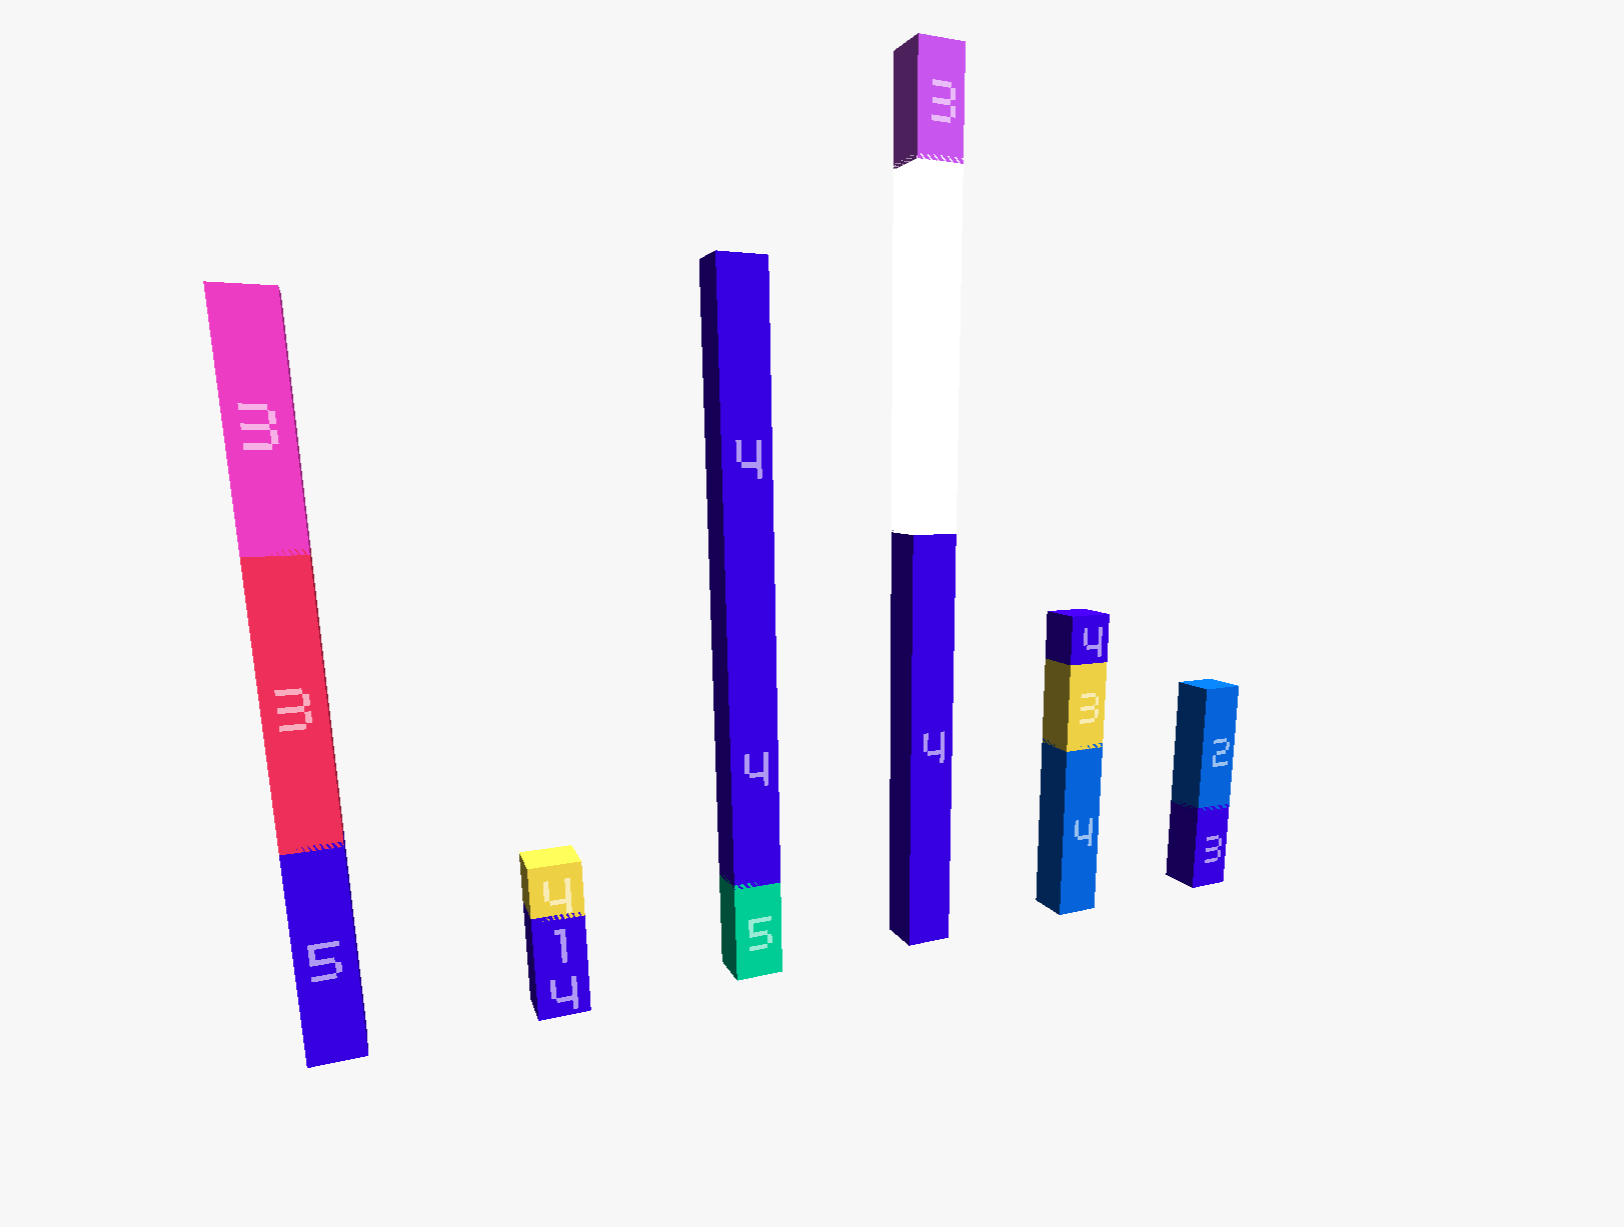
We were inspired by the idea of using the metaphor of building blocks, as alumni “build their careers”.
Using this metaphor, we are able to show proportional time spent, additionally reflect these response from “the city” by each block tower.
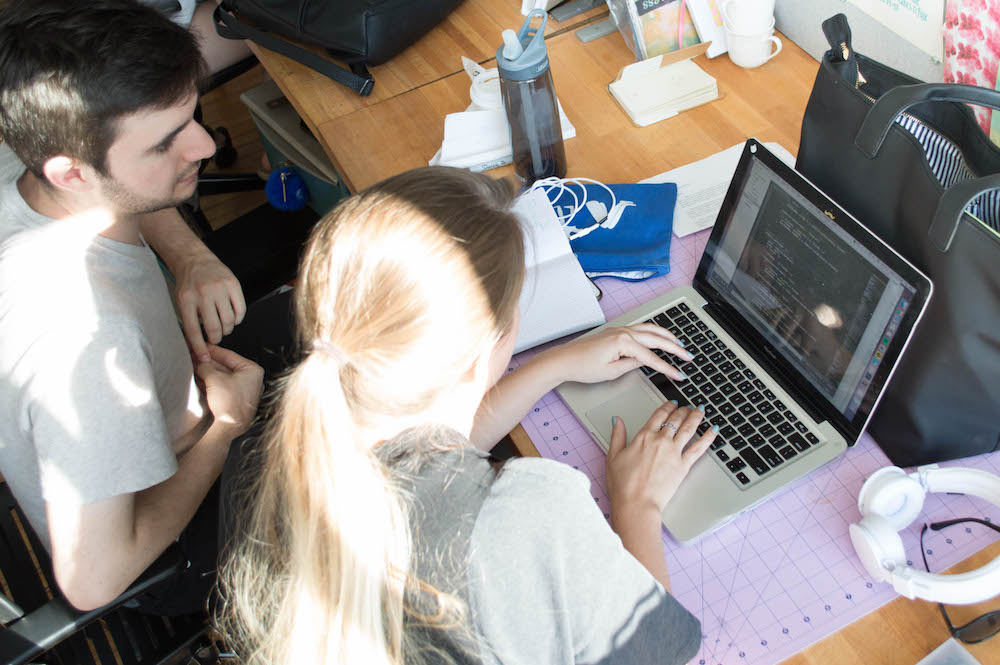
Once this construct had been tested against our data, we began ideating the appearance of these towers and how we might communicate each response through the visual. My role in the project was leading the brainstorming sessions, and the interaction and development of the web visualization using Java’s 3D library. As my teammates iterated on the design of appearance of the blocks, our project moved forward through a negotiation of the platform’s limits and our time constraint. Meanwhile we also fleshed out the storyboard of our users interaction of the site. Through crafting the narrative of student discovering their alumni’ career path we were able to dictate the pertinent information for them to see on this site. The experience begins with an introductory video of the data, followed by the intractable visualization, followed by an about page and take-aways we observed. that a casual viewer may have missed.
My Learning Take-Aways
This was the largest team project that I had ever been on. My most valuable learning experiences was finding my place in the team setting, and always making sure that I am contributing to the progress of the project. Although I know more about coding java in the 3D landscape than I ever have before, more importantly I learned the importance of scaling a project. I am now more confident in my ability to scope a project, and its interaction based on the amount of skill and time available.